Sometimes things don't go the way you want them to.
Adventure Time has a very unique and iconic visual style, which includes its color choices. So I was very excited to expand last week's analysis of Adventure Time's title cards into an analysis of the actual content of the show.
For example, I was hoping it would be possible to identify which characters appear in each episode based on whether the the episode prominently features those characters' iconic color schemes.
But when I sat down to do the analysis, it didn't exactly go as planned. First of all, I had less time to devote to this task than I thought. I knew it would be a time-consuming task, but I ended up being busier this week than I expected.
(The reason this task takes so long is not due to the image processing itself, which is fully automated and takes a few minutes per episode on my laptop. It's because I have to lightly edit each individual episode. For instance, I have to cut out the opening and closing themes so they don't factor into the results.)
The second way this project took a turn for the unexpected was simply that the data was not very interesting!
Here are the color schemes of each episode of the first season1:
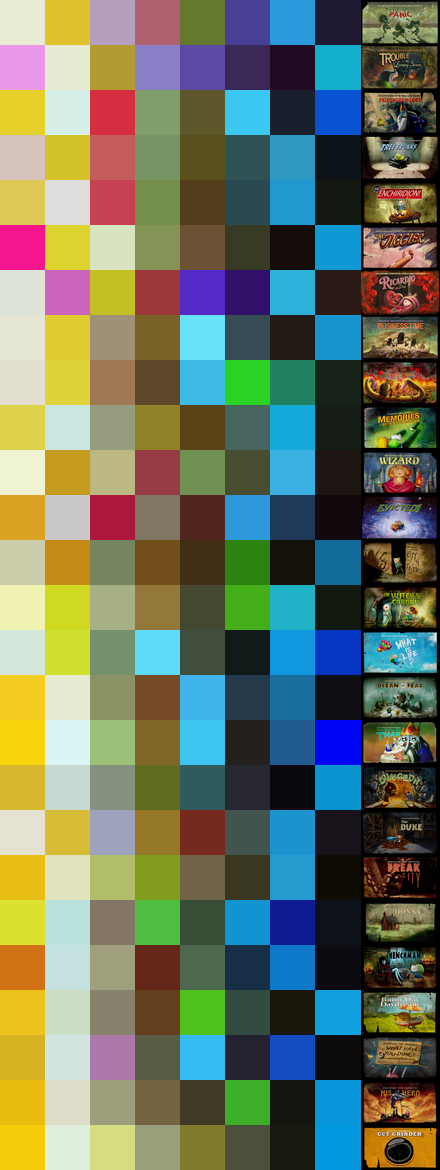
There's a few things I see in this data that I like:
- We can actually see a few examples of characters being identified by their colors, especially in cases like episode 2, "Trouble in Lumpy Space."
- There are a lot of blues and yellows here. Blue probably comes from Finn and yellow probably comes from Jake.
- The show is a lot muddier than I expected. This might have more to do with my method of data collection/analysis than any actual feature of the show, but it's interesting either way.
But really, this data doesn't tell me much. It seems all over the place. I feel like I could write an algorithm for generating realistic Adventure Time color schemes: 3-4 bright blues, 1-2 bright yellows, some mud, and fill in the rest semi-randomly, preferably with a reddish or greenish color. If you run out of colors, just add a black.
The fact is, after spending a lot of time editing videos and extracting data, I'm left with an array of colors that don't mean anything to me. This data isn't telling me anything new or exciting: I already know which episodes feature Lumpy Space Princess, and that Finn and Jake have the most screen time. These are facts that are more directly and reliably measurable through other means.
So I'm calling this an uninteresting experiment. It wasn't a "failure" in the strictest sense, because I enjoyed the experience and got a pretty picture out of it.
More importantly, I had this opportunity to reflect on my methods and expectations — sometimes that's more valuable than the data you seek in the first place.
So... what now? I still think there's interesting data to be collected about Adventure Time's use of color. I certainly haven't exhausted the topic to its fullest.
I think this is a problem of scale. Using episodes as my smallest measurement and seasons as my largest just didn't work. Next time, I should either compare seasons to each other or compare scenes within individual episodes.
I think it's worth looking at the scenes of a single episode, but this requires extra manual work of marking scene transitions within each episode. In other words, it's much harder to automate than either of the tasks I've done so far.
Still, it's a topic I'd like to explore, but I haven't decided how best to do it yet. But I hope to revisit this area sometime.
In the meantime, I will open source the code I used to do this analysis. Maybe someone else will do something interesting with it! I'll update this post with a link as soon as I finish putting that together.
Update: You can find my scripts for this analysis on GitLab.